Census Bureau Reports Shows Poverty Unchanged But Incomes Down
The Census Bureau’s annual income, poverty, and health-insurance report was released this morning. Matthew Zeitlin goes inside the numbers.

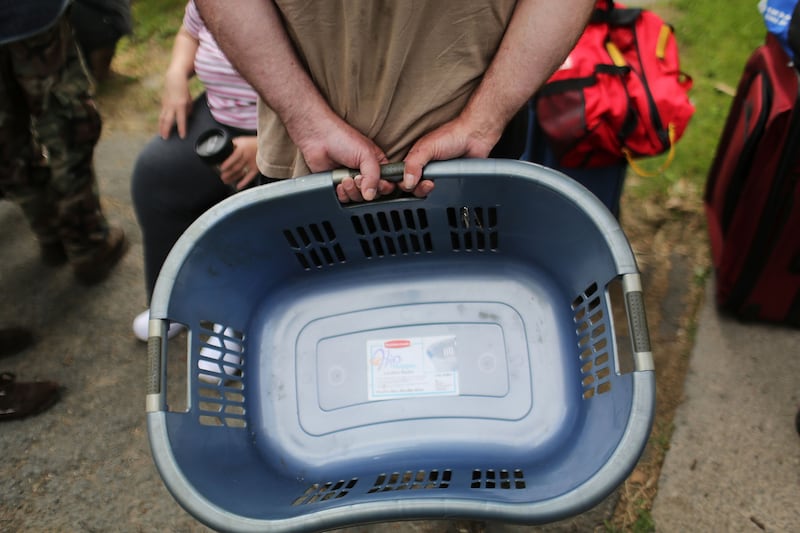
Spencer Platt / Getty Images
Get the Beast Digest newsletter delivered straight to your inbox
By clicking “SIGN UP” you agree to our Terms of Use and Privacy Policy.
On Wednesday the Census Bureau released its massive annual report on poverty, income, and health insurance. The report is one of the most comprehensive annual breakdowns of how Americans stand financially. The news was decidedly mixed, showing some improvements, some stagnation, and some falling back. The full report can be seen here. Here are the five most important takeaways:
(1) Poverty was basically unchanged in 2011.
In 2011 there were 46.2 million people living in poverty—defined as a family of four with an income of $23,021 or less. The poverty rate was 15 percent, which is basically flat from 2010. Last year was actually the first in the last four in which neither the poverty rate nor the number of people living in poverty didn’t go up. Ron Haskins, a senior fellow at the Brookings Institution, said that despite the fact that poverty didn’t increase, it was “still higher than it has been in all but two years since the mid-1960s.”
(2) Median incomes declined—again.
The real median household income in 2011 was $50,054, a 1.5 percent drop from 2010 and an 8.1 percent drop from 2007, the prerecession peak. This also represented an 8.9 percent drop from 1999, the all-time peak. The Census Bureau’s data show that typical households haven’t just experienced a crushing recession, but a lost decade in terms of stagnant incomes.
(3) Income inequality went up.
According to two different measures, income inequality was higher in 2011 than the year before. In other words, it was a good year for the 1 percent. According to the Gini index, a measure of inequality in which 0 represents total income equality and 1 represents one household having all the income, income inequality was up 1.6 percent in 2011 from 2010. (The Gini index came in at 0.477). The top 20 percent saw their income share rise 1.6 percent to 51.1 percent, while the income share for the top 5 percent rose 4.9 percent, to 22.3 percent of the national pie. The broad middle—the two quintiles that included the 40 to 80 percent—saw its share of national income drop from 38 percent to 37.3 percent.
(4) More people have health insurance.
Perhaps the most striking—and positive—data in the report concerned health insurance. About 48.6 million people did not have health insurance in 2011. That’s terrible. But it’s actually down from 50 million in 2010. Accordingly, the portion of the population without insurance also declined to 15.7 percent from 16.3 percent in 2011. It was also the first time in 10 years that the portion of people with private health insurance has not gone down—in 2011 the private insurance rate was 63.9 percent. These numbers most likely reflect the fact that the economy added 1.8 milion jobs in 2011.
(5) Young people are still living with their parents.
The number of “shared households,” which the Census Bureau defines as households with at least one adult who isn’t in school or one of two other adults, didn’t go up in 2011. Still, it has risen by 2.6 million from 19.7 million in 2007 to 22.3 million in 2012, an increase of 13.2 percent. These households are now 18.4 percent of all households, up from 17 percent in 2007.
See more of our coverage in your search results.

Got a tip? Send it to The Daily Beast here.
Unlock a year of full access to The Daily Beast for $35.
Monthly
$1
First month then $5.99/month
Annual
$35
First year then $59.99/year
Premium
$79
First year then $119.99/year
*Substack access provided by the next business day, using your subscription email. Choosing the Premium plan constitutes your permission to share your subscription email with Substack and your agreement to Substack’s Privacy Policy.
Looks like you already have a subscription!
- Account (completed)
- Payment (completed)
- Confirmation (completed)
You're all set!
Thanks for subscribing.
- 1Account
- 2Payment
- 3Confirmation
Sign in or create an account
Register below to read this article for free or subscribe
to unlock unlimited access to The Daily Beast.
Monthly
$1
First month then $5.99/month
Annual
$35
First year then $59.99/year
Premium
$79
First year then $119.99/year
*Substack access provided by the next business day, using your subscription email. Choosing the Premium plan constitutes your permission to share your subscription email with Substack and your agreement to Substack’s Privacy Policy.
Already have an account? Sign In
Looks like you already have a subscription!
- Account (completed)
- Payment (completed)
- Confirmation (completed)
You're all set!
Thanks for subscribing.
- 1Account
- 2Payment
- 3Confirmation