
Where are the country’s deadliest drivers? The Daily Beast analyzes the statistics to figure out what states are worst when it comes to traffic safety.
Forget talking while driving, one of the most prevalent threats to safety on the road is texting. According to the National Transportation Safety Board, states should pass laws to ban the use of electronic devices while driving. But, while distracted driving accounts for 16 percent of fatalities, drunken driving is responsible for nearly double the fatal crashes every year.
To get a state-by-state picture of where the most careless, distracted, and drunk drivers reside, The Daily Beast turned to the National Highway Traffic Safety Administration’s most recent statistics on traffic fatalities. States were considered based on the number of fatalities per miles driven and fatalities per capita, which each accounted for 45 percent of the final weight. Ten percent of the final score was derived from the percentage of drivers that use seatbelts.

2010 Traffic fatalities: 390
Percent of fatalities from alcohol impairment: 23%
Percent of fatalities from speeding: 16%
Fatalities per 100 million miles driven (rank out of 50 states)*: 26
Fatalities per 100,000 people (rank out of 50 states): 22
Seatbelt usage: 93.10%
*2009 data
Chip Somodevilla / Getty Images
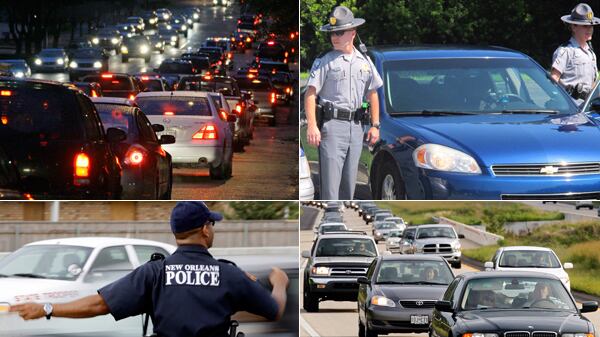
2010 Traffic fatalities: 101
Percent of fatalities from alcohol impairment: 36%
Percent of fatalities from speeding: 42%
Fatalities per 100 million miles driven (rank out of 50 states)*: 22
Fatalities per 100,000 people (rank out of 50 states): 28
Seatbelt usage: 90.70%
*2009 data
Alex Brandon / AP Photo
2010 Traffic fatalities: 1244
Percent of fatalities from alcohol impairment: 24%
Percent of fatalities from speeding: 17%
Fatalities per 100 million miles driven (rank out of 50 states)*: 28
Fatalities per 100,000 people (rank out of 50 states): 21
Seatbelt usage: 89.60%
*2009 data
Erik S. Lesser, Bloomberg / Getty Images
2010 Traffic fatalities: 2998
Percent of fatalities from alcohol impairment: 42%
Percent of fatalities from speeding: 40%
Fatalities per 100 million miles driven (rank out of 50 states)*: 17
Fatalities per 100,000 people (rank out of 50 states): 25
Seatbelt usage: 93.80%
*2009 data
Tony Gutierrez / AP Photo
2010 Traffic fatalities: 1319
Percent of fatalities from alcohol impairment: 29%
Percent of fatalities from speeding: 37%
Fatalities per 100 million miles driven (rank out of 50 states)*: 24
Fatalities per 100,000 people (rank out of 50 states): 17
Seatbelt usage: 89.70%
*2009 data
Davis Turner / Getty Images
2010 Traffic fatalities: 762
Percent of fatalities from alcohol impairment: 25%
Percent of fatalities from speeding: 32%
Fatalities per 100 million miles driven (rank out of 50 states)*: 19
Fatalities per 100,000 people (rank out of 50 states): 24
Seatbelt usage: 81.80%
*2009 data
Jeff Topping / Getty Images
2010 Traffic fatalities: 2445
Percent of fatalities from alcohol impairment: 27%
Percent of fatalities from speeding: 19%
Fatalities per 100 million miles driven (rank out of 50 states)*: 18
Fatalities per 100,000 people (rank out of 50 states): 20
Seatbelt usage: 87.40%
*2009 data
John VanBeekum / AP Photo
2010 Traffic fatalities: 819
Percent of fatalities from alcohol impairment: 32%
Percent of fatalities from speeding: 39%
Fatalities per 100 million miles driven (rank out of 50 states)*: 23
Fatalities per 100,000 people (rank out of 50 states): 18
Seatbelt usage: 76.00%
*2009 data
AP Photo
2010 Traffic fatalities: 431
Percent of fatalities from alcohol impairment: 39%
Percent of fatalities from speeding: 23%
Fatalities per 100 million miles driven (rank out of 50 states)*: 19
Fatalities per 100,000 people (rank out of 50 states): 16
Seatbelt usage: 81.80%
*2009 data
Bo Rader, Wichita Eagle / Getty Images
2010 Traffic fatalities: 209
Percent of fatalities from alcohol impairment: 34%
Percent of fatalities from speeding: 32%
Fatalities per 100 million miles driven (rank out of 50 states)*: 12
Fatalities per 100,000 people (rank out of 50 states): 19
Seatbelt usage: 77.90%
*2009 data
Jeff T. Green / Getty Images
2010 Traffic fatalities: 346
Percent of fatalities from alcohol impairment: 32%
Percent of fatalities from speeding: 38%
Fatalities per 100 million miles driven (rank out of 50 states)*: 15
Fatalities per 100,000 people (rank out of 50 states): 12
Seatbelt usage: 89.80%
*2009 data
Alan Copson / Corbis
2010 Traffic fatalities: 1031
Percent of fatalities from alcohol impairment: 27%
Percent of fatalities from speeding: 22%
Fatalities per 100 million miles driven (rank out of 50 states)*: 13
Fatalities per 100,000 people (rank out of 50 states): 13
Seatbelt usage: 87.10%
*2009 data
Mark Humphrey / AP Photo
2010 Traffic fatalities: 140
Percent of fatalities from alcohol impairment: 26%
Percent of fatalities from speeding: 23%
Fatalities per 100 million miles driven (rank out of 50 states)*: 16
Fatalities per 100,000 people (rank out of 50 states): 10
Seatbelt usage: 74.50%
*2009 data
AP Photo
2010 Traffic fatalities: 862
Percent of fatalities from alcohol impairment: 32%
Percent of fatalities from speeding: 37%
Fatalities per 100 million miles driven (rank out of 50 states)*: 10
Fatalities per 100,000 people (rank out of 50 states): 5
Seatbelt usage: 91.40%
*2009 data
AP Photo
2010 Traffic fatalities: 862
Percent of fatalities from alcohol impairment: 32%
Percent of fatalities from speeding: 37%
Fatalities per 100 million miles driven (rank out of 50 states)*: 10
Fatalities per 100,000 people (rank out of 50 states): 6
Seatbelt usage: 79.20%
*2009 data
AP Photo
2010 Traffic fatalities: 862
Percent of fatalities from alcohol impairment: 32%
Percent of fatalities from speeding: 37%
Fatalities per 100 million miles driven (rank out of 50 states)*: 10
Fatalities per 100,000 people (rank out of 50 states): 6
Seatbelt usage: 79.20%
*2009 data
Henryk Sadura / Corbis
2010 Traffic fatalities: 105
Percent of fatalities from alcohol impairment: 45%
Percent of fatalities from speeding: 40%
Fatalities per 100 million miles driven (rank out of 50 states)*: 7
Fatalities per 100,000 people (rank out of 50 states): 15
Seatbelt usage: 74.80%
*2009 data
Bloomberg / Getty Images
2010 Traffic fatalities: 760
Percent of fatalities from alcohol impairment: 23%
Percent of fatalities from speeding: 20%
Fatalities per 100 million miles driven (rank out of 50 states)*: 8
Fatalities per 100,000 people (rank out of 50 states): 8
Seatbelt usage: 80.30%
*2009 data
Henryk Sadura / Getty Images
2010 Traffic fatalities: 710
Percent of fatalities from alcohol impairment: 32%
Percent of fatalities from speeding: 33%
Fatalities per 100 million miles driven (rank out of 50 states)*: 2
Fatalities per 100,000 people (rank out of 50 states): 14
Seatbelt usage: 75.90%
*2009 data
AP Photo
2010 Traffic fatalities: 810
Percent of fatalities from alcohol impairment: 44%
Percent of fatalities from speeding: 35%
Fatalities per 100 million miles driven (rank out of 50 states)*: 3
Fatalities per 100,000 people (rank out of 50 states): 9
Seatbelt usage: 85.40%
*2009 data
Bruce Smith / AP Photo
2010 Traffic fatalities: 315
Percent of fatalities from alcohol impairment: 28%
Percent of fatalities from speeding: 42%
Fatalities per 100 million miles driven (rank out of 50 states)*: 3
Fatalities per 100,000 people (rank out of 50 states): 11
Seatbelt usage: 82.10%
*2009 data
Walter Bibikow / Corbis
2010 Traffic fatalities: 563
Percent of fatalities from alcohol impairment: 31%
Percent of fatalities from speeding: 19%
Fatalities per 100 million miles driven (rank out of 50 states)*: 5
Fatalities per 100,000 people (rank out of 50 states): 3
Seatbelt usage: 78.30%
*2009 data
Danny Johnston / AP Photo
2010 Traffic fatalities: 641
Percent of fatalities from alcohol impairment: 37%
Percent of fatalities from speeding: 20%
Fatalities per 100 million miles driven (rank out of 50 states)*: 6
Fatalities per 100,000 people (rank out of 50 states): 2
Seatbelt usage: 81.00%
*2009 data
Rogelio V. Solis / AP Photo
2010 Traffic fatalities: 155
Percent of fatalities from alcohol impairment: 35%
Percent of fatalities from speeding: 37%
Fatalities per 100 million miles driven (rank out of 50 states)*: 13
Fatalities per 100,000 people (rank out of 50 states): 1
Seatbelt usage: 78.90%
*2009 data
Stephen Brashear / Getty Images
2010 Traffic fatalities: 189
Percent of fatalities from alcohol impairment: 39%
Percent of fatalities from speeding: 36%
Fatalities per 100 million miles driven (rank out of 50 states)*: 1
Fatalities per 100,000 people (rank out of 50 states): 4
Seatbelt usage: 78.90%
*2009 data
Stephen Brashear / Getty Images