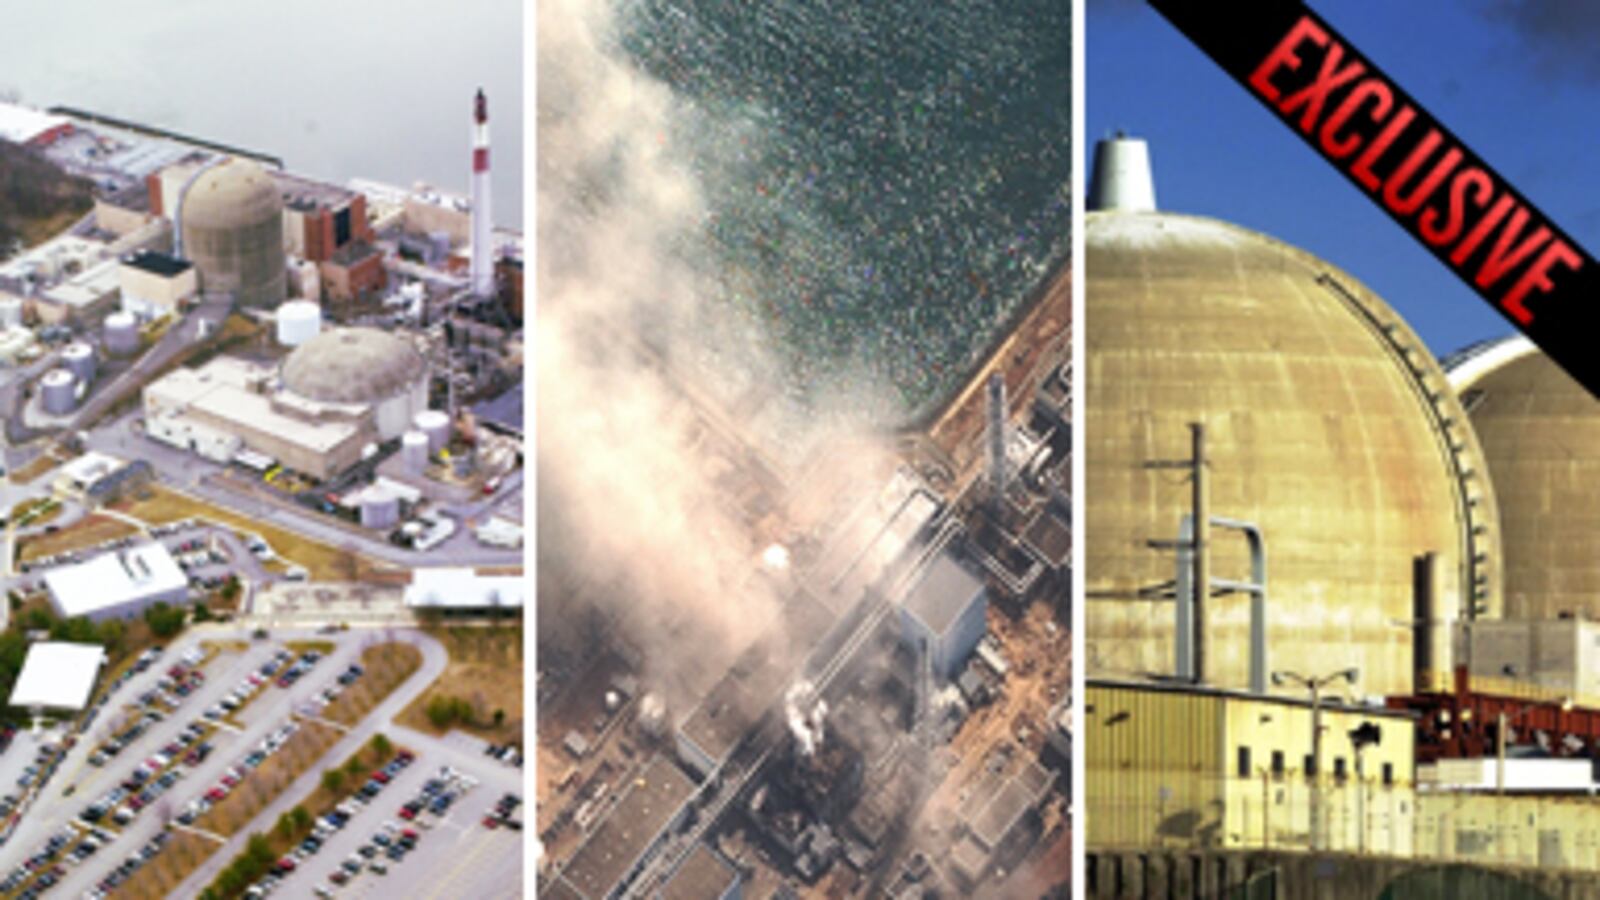
For this ranking of nuclear power plant vulnerability, safety records, natural disaster possibilities and nearby populations were ranked equally.

For each facility, we tabulated the population residing within 50 miles, which is defined as the “ingestion exposure” area where exposure to radiation would likely occur through contaminated food or water. Estimates are based on the most recent circular area profile available from the Missouri Census Data Center..
To analyze the risk of natural disaster, we looked at the likelihood of an earthquake, hurricane, tornado, and volcanic eruption for each reactor site according to the most relevant metric, as follows:
• Earthquake: The precise seismic hazard level, according to U.S. Geological Survey. Levels, ranked on a 0-6 point scale according to hazard ranges presented in the most recent national seismic map. • Hurricane: The expected number of hurricanes predicted to occur based on historical data, according to USGS • Tornado: The number of significant tornado days per century according to data charted from 1921-1995, the dataset which is widely accepted as the most complete and predictive measure of tornadoes currently available. • Volcano: The proximity to potentially active volcanoes
In our composite natural disaster score, the risk of an earthquake was weighted twice that of hurricanes and tornadoes, and proximity to potentially active volcanoes was weighted at half, to account for level of destruction and odds of occurrence.
Performance assessments were culled from the United States Nuclear Regulatory Commission (NRC). We considered the degree of risk according to the most significant inspection findings for each reactor over the previous 4 quarters across six indicators (e.g. emergency preparedness, barrier integrity). The NRC summarizes its findings on a color scale to represent deficiencies that range from having low risk significance with “little or no impact on safety” to inspection findings with a greater degree of safety significance that lead to increased regulatory oversight. We converted the color codes to a simple point scale from 0 to 4. For sites with multiple reactors, the scores were averaged.
We also converted the Commission’s overall level of assessment for each plant for the most recent quarter, which was released earlier this month and is based on five levels of plant performance, on a simple 5-point scale. Of the 104 reactors in operation in the U.S., 89 reactors ranked at the highest level, nine ranked at the second highest level and six ranked at the third level of performance.


