

After a president leaves office, it’s his chance to leave the relatively low-paying world of public service and start bringing in some serious coin, whether through book royalties, business ventures, or speaking fees (Bill Clinton made more than $13 million talking last year alone).
But what about the candidates vying for the most important job in America—how do they, and specifically their earnings, compare to the average American? To find out how candidates’ earnings matched up to Main Street’s, we started by examining adjusted gross income—including capital gains—from the tax returns of each of the two major-party candidates (so no Ross Perot) the year before each election. For the 2008 election, for example, we looked at Barack Obama’s return for 2007. For John McCain and John Kerry, who both married heiresses, we also took into account spousal earnings.
We then used national income estimates from Berkeley economist Emmanuel Saez and Paris School of Economics professor Thomas Piketty. These income estimates are based around tax units—which include married couples and people filing singly—and include capital-gains income. For the current election between Mitt Romney and Obama we used 2010 income estimates, the most recent available. All dollar amounts are real and not adjusted for inflation.
Finally, we ranked the candidates by how many times richer each one was while running that the average American. Of the 25 candidates we counted, the seven (counting Bill Clinton and Jimmy Carter twice) with the most mundane cash flows were all Democrats, with Michael Dukakis coming closest to the common man, earning just 4.33 times more than the average citizen.
And the least common candidate? Mitt Romney, of course, who despite being “unemployed” in 2011, still took in more than 400 times the average Joe or Jane.
Because releasing tax returns didn’t become the norm until after Watergate, the list covers every major-party candidate going back to 1972, and a few earlier ones going back to 1952. We compiled figures from digital versions of the returns for recent candidates, when available, and from historical press reports when actual returns were unavailable.
—Clark Merrefield and Lauren Streib

Per dollar the average American earned, Romney earned: $405.45
Candidate income: $20,901,075
Average American income: $51,550
Total federal taxes paid by candidate: $3,226,623
Effective tax rate: 15.4%
Evan Vucci / AP Photo
Per dollar the average American earned, Kerry earned: $123.93
Candidate income: $5,465,338
Average American income: $44,102
Total federal taxes paid by candidate: $718,976
Effective tax rate: 13.2%
**Income and tax figures are combined from individual filings of John Kerry and spouse Teresa Heinz
Laura Rauch / AP Photo
Per dollar the average American earned, McCain earned: $78.95
Candidate income: $4,583,555
Average American income: $58,056
Total federal taxes paid by candidate: $1,256,849
Effective tax rate: 27.4%
**Income and tax figures are combined from individual filings of John McCain and spouse Cindy McCain
Chip Somodevilla / Getty Images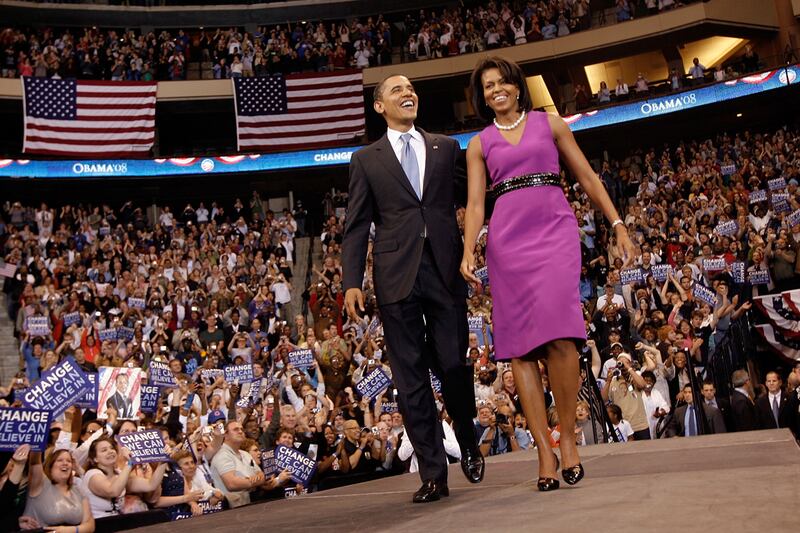
Per dollar the average American earned, Obama earned: $71.30
Candidate income: $4,139,165
Average American income: $58,056
Total federal taxes paid by candidate: $1,396,772
Effective tax rate: 33.7%
Chip Somodevilla / Getty Images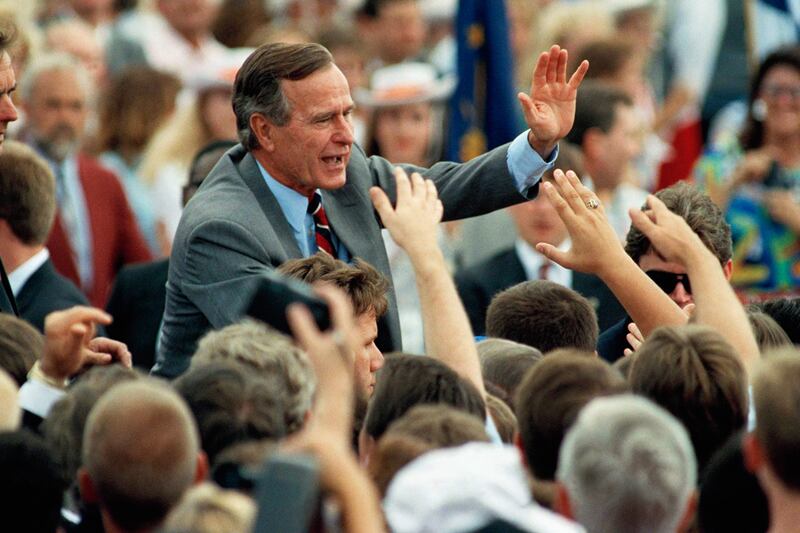
Per dollar the average American earned, Bush earned: $45.74
Candidate income: $1,324,456
Average American income: $28,957
Total federal taxes paid by candidate: $204,841
Effective tax rate: 15.5%
AP Photo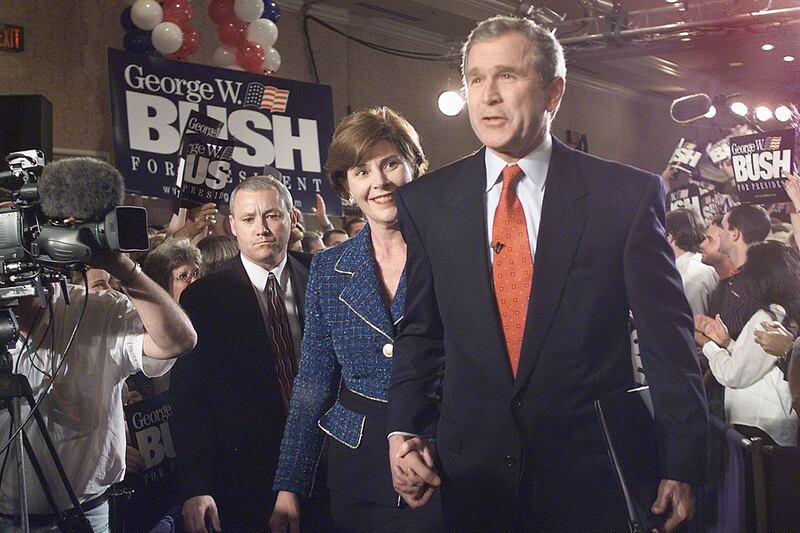
Per dollar the average American earned, Bush earned: $36.27
Candidate income: $1,610,400
Average American income: $44,396
Total federal taxes paid by candidate: $449,827
Effective tax rate: 27.9%
Paul J. Richards, AFP / Getty Images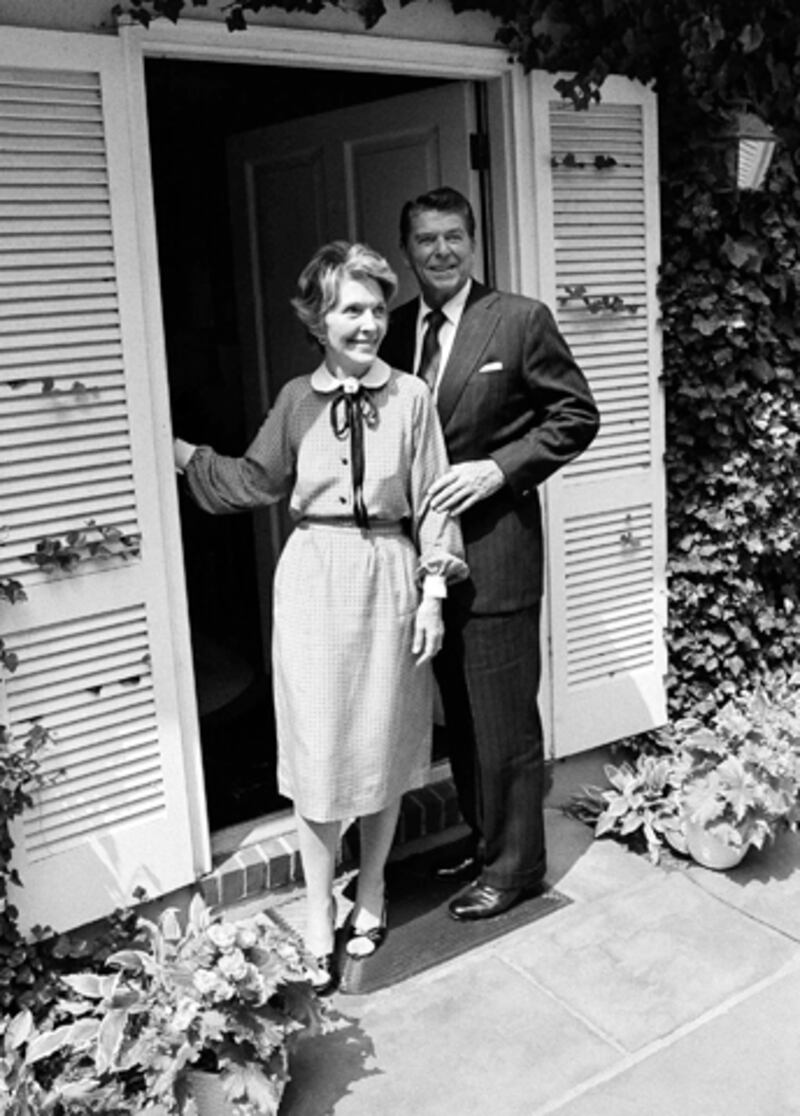
Per dollar the average American earned, Reagan earned: $32.47
Candidate income: $515,878
Average American income: $15,888
Total federal taxes paid by candidate: $230,886
Effective tax rate: 44.8%
AP Photo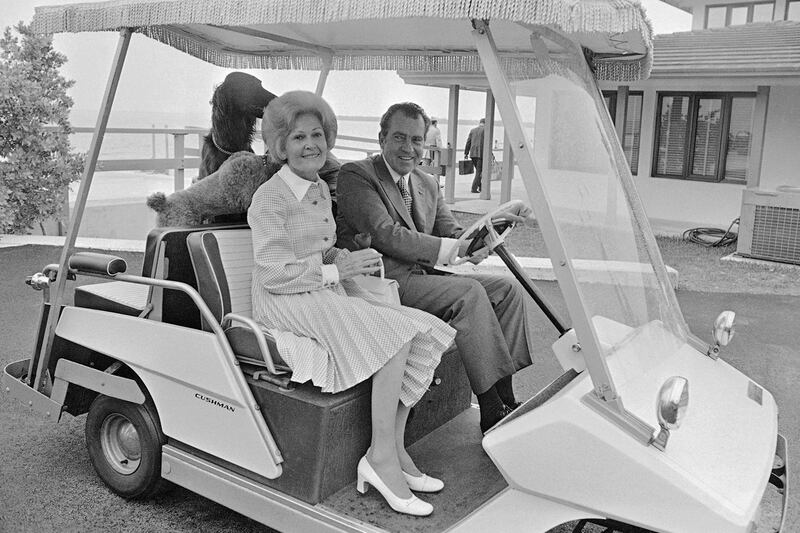
Per dollar the average American earned, Nixon earned: $30.25
Candidate income: $262,385
Average American income: $8,673
Total federal taxes paid by candidate: $18,153.18
Effective tax rate: 7%
AP Photo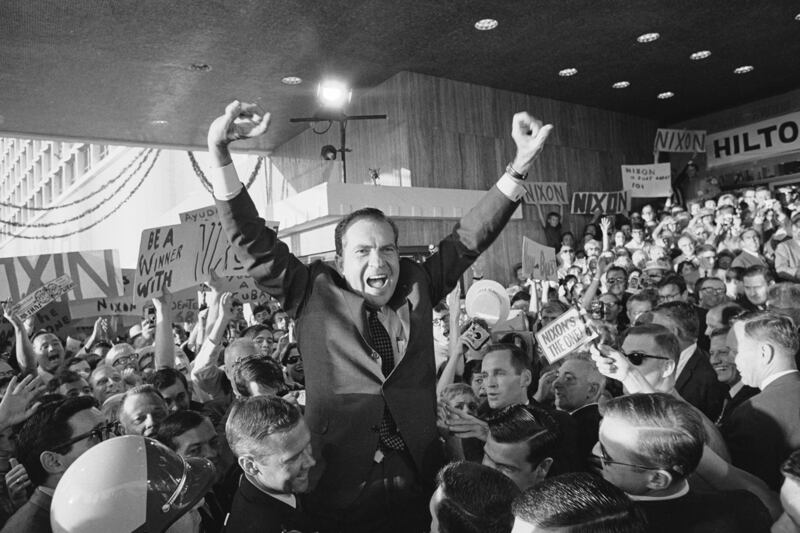
Per dollar the average American earned, Nixon earned: $28.93
Candidate income: approximately $200,000
Average American income: $6,914
Total federal taxes paid by candidate: n/a ($60,000 in total state and federal taxes)
Effective tax rate: n/a
AP Photo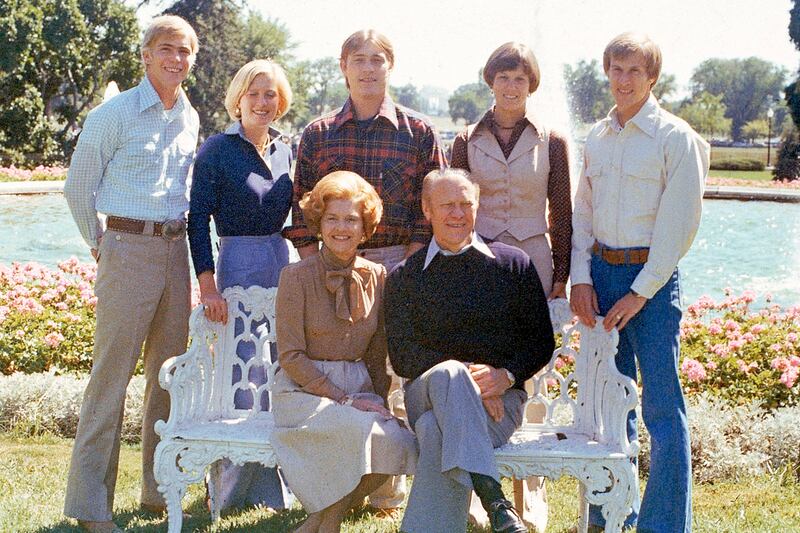
Per dollar the average American earned, Ford earned: $22.59
Candidate income: $251,991
Average American income: $11,156
Total federal taxes paid by candidate: $94,569
Effective tax rate: 37.5%
AP Photo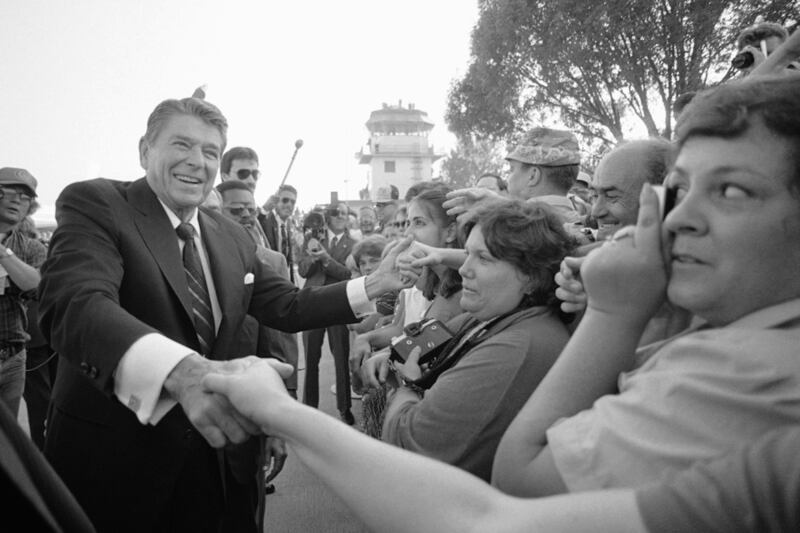
Per dollar the average American earned, Reagan earned: $20.89
Candidate income: $423,000
Average American income: $20,252
Total federal taxes paid by candidate: $129,000
Effective tax rate: 30.5%
AP Photo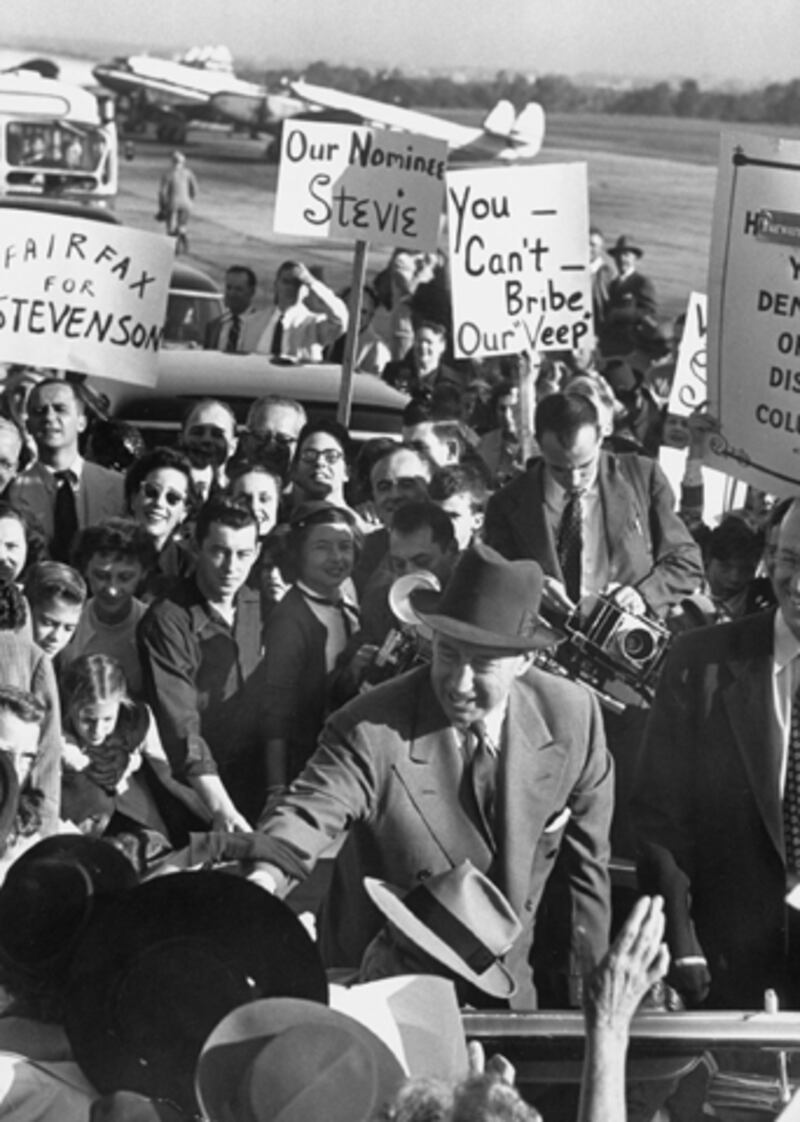
Per dollar the average American earned, Stevenson earned: $20.72
Candidate income: $69,273
Average American income: $3,343
Total federal taxes paid by candidate*: $21,198.04
Effective tax rate: 30.6%
*Figure is an average of taxes paid in the ten years leading up to campaign, according to historical press accounts
Mark Kauffman, Time Life Pictures / Getty Images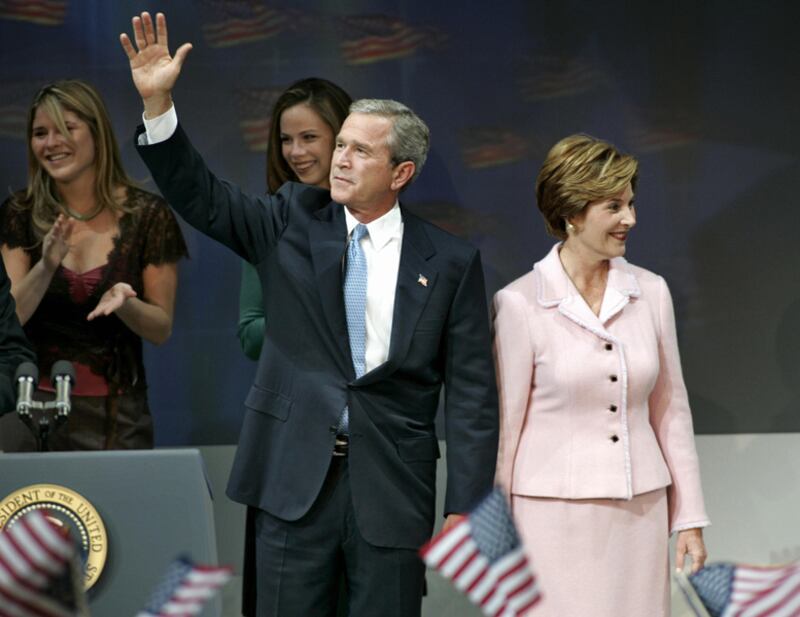
Per dollar the average American earned, Bush earned: $18.64
Candidate income: $822,126
Average American income: $44,102
Total federal taxes paid by candidate: $227,490
Effective tax rate: 27.7%
Timothy A. Clary, AFP / Getty Images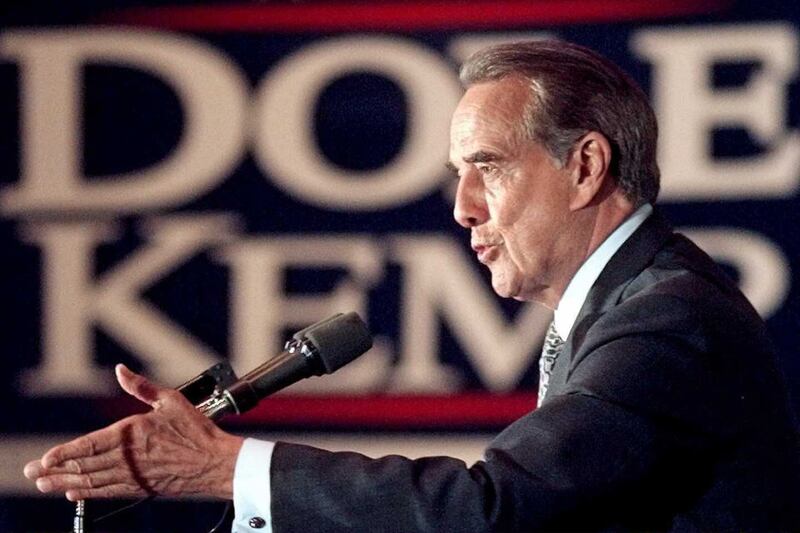
Per dollar the average American earned, Dole earned: $17.44
Candidate income: $583,869
Average American income: $33,472
Total federal taxes paid by candidate: $136,848
Effective tax rate: 23.4%
David Ake, AFP / Getty Images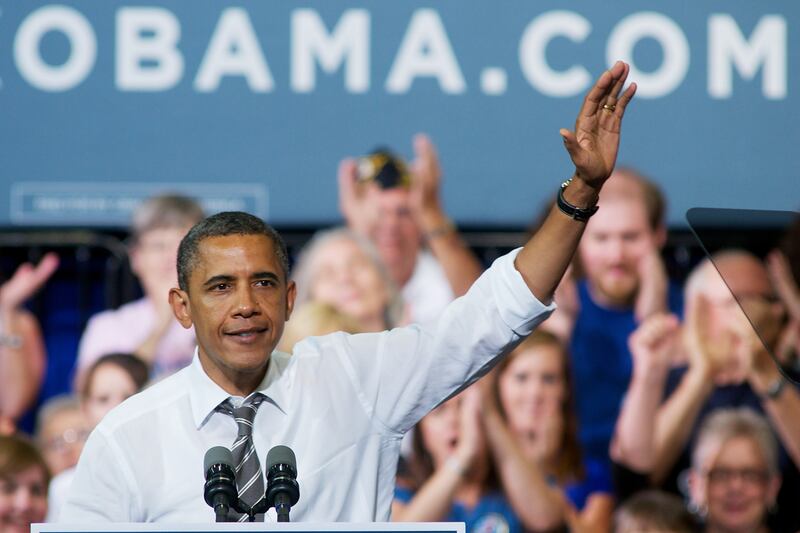
Per dollar the average American earned, Obama earned: $15.32
Candidate income: $789,674
Average American income: $51,550
Total federal taxes paid by candidate: $162,074
Effective tax rate: 20.5%
David Greedy / Getty Images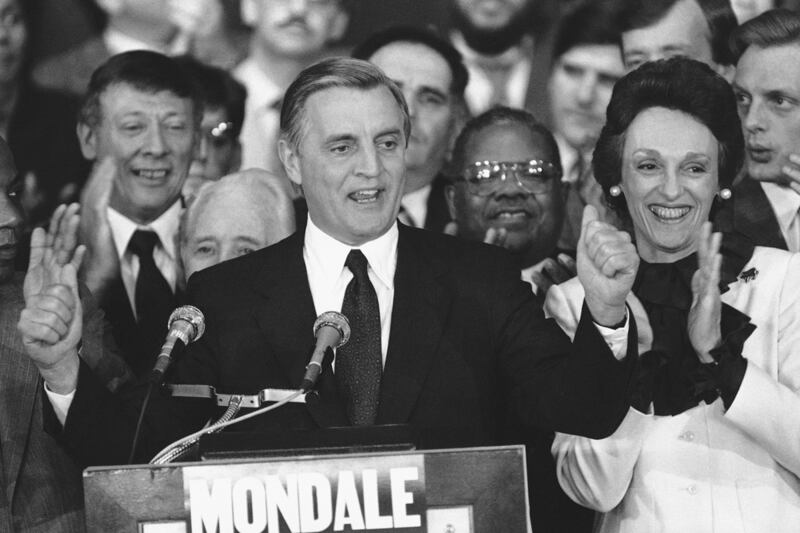
Per dollar the average American earned, Mondale earned: $14.61
Candidate income: $296,000
Average American income: $20,252
Total federal taxes paid by candidate: $97,000
Effective tax rate: 32.8%
Rusty Kennedy / AP Photo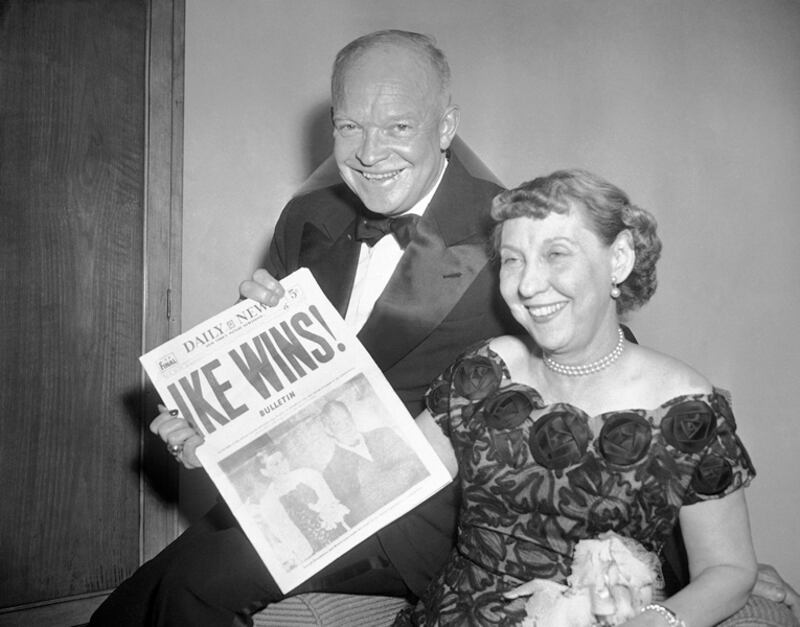
Per dollar the average American earned, Eisenhower earned: $14.46
Candidate income*: $48,331.83
Average American income: $3,343
Total federal taxes paid by candidate*: $12,154.21
Effective tax rate: 25.1%
*Figures are an average of total income and taxes in the four years leading up to campaign, according to historical press accounts
AP Photo
Per dollar the average American earned, Bush earned: $12.36
Candidate income: $308,000
Average American income: $24,920
Total federal taxes paid by candidate: $86,000
Effective tax rate: 27.9%
J. Scott Applewhite / AP Photo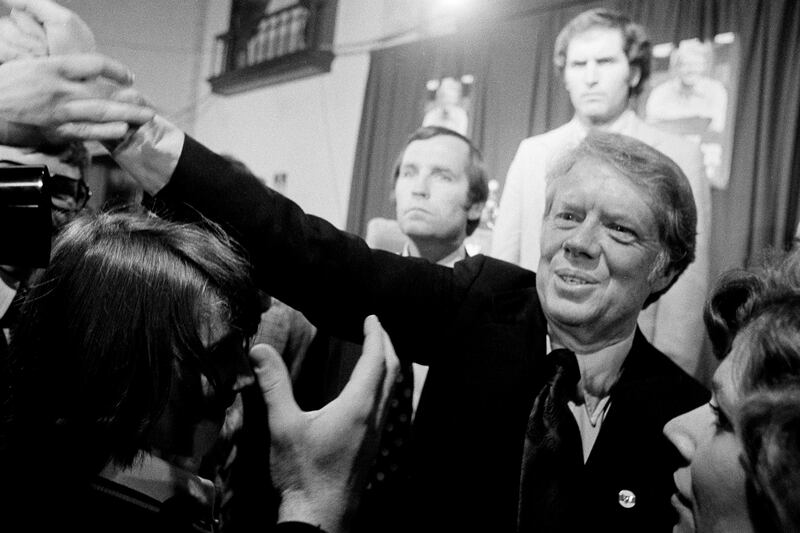
Per dollar the average American earned, Carter earned: $12.27
Candidate income: $136,926
Average American income: $11,156
Total federal taxes paid by candidate: $16,702
Effective tax rate: 12.2%
AP Photo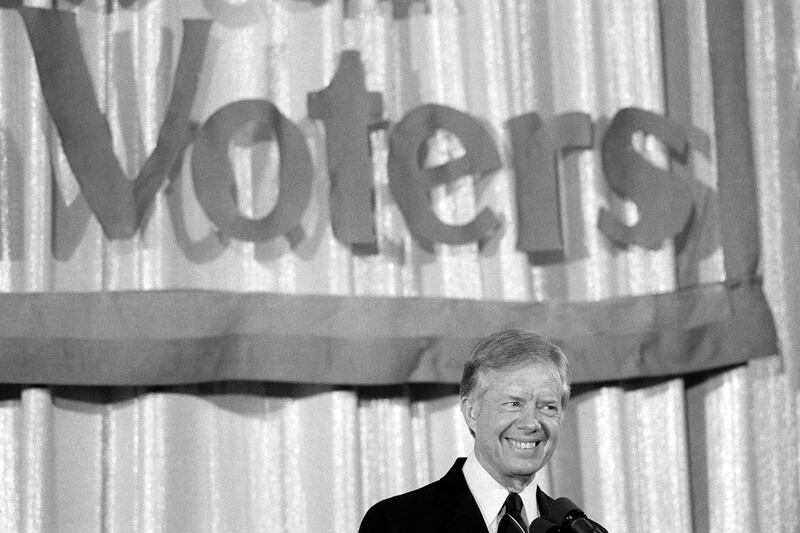
Per dollar the average American earned, Carter earned: $12.20
Candidate income: $193,824
Average American income: $15,888
Total federal taxes paid by candidate: $64,945
Effective tax rate: 33.5%
AP Photo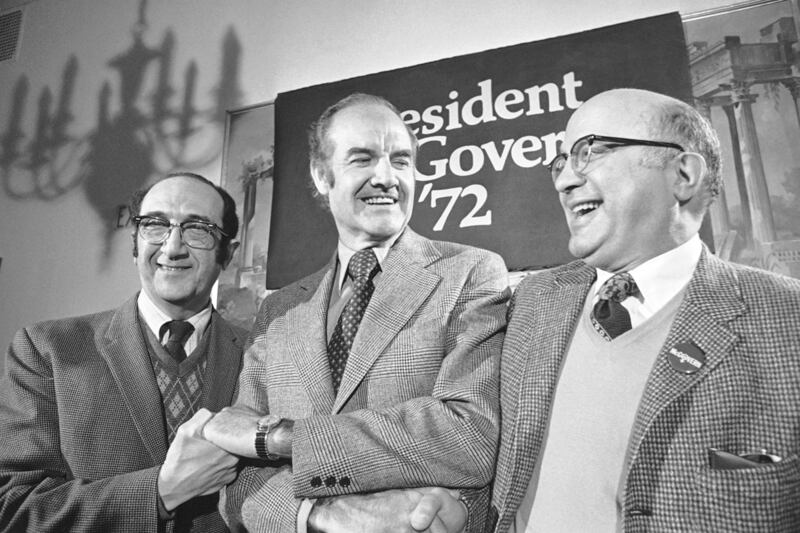
Per dollar the average American earned, McGovern earned: $10.27
Candidate income: $89,100
Average American income: $8,673
Total federal taxes paid by candidate: $34,223
Effective tax rate: 38.4%
Bill Chaplis / AP Photo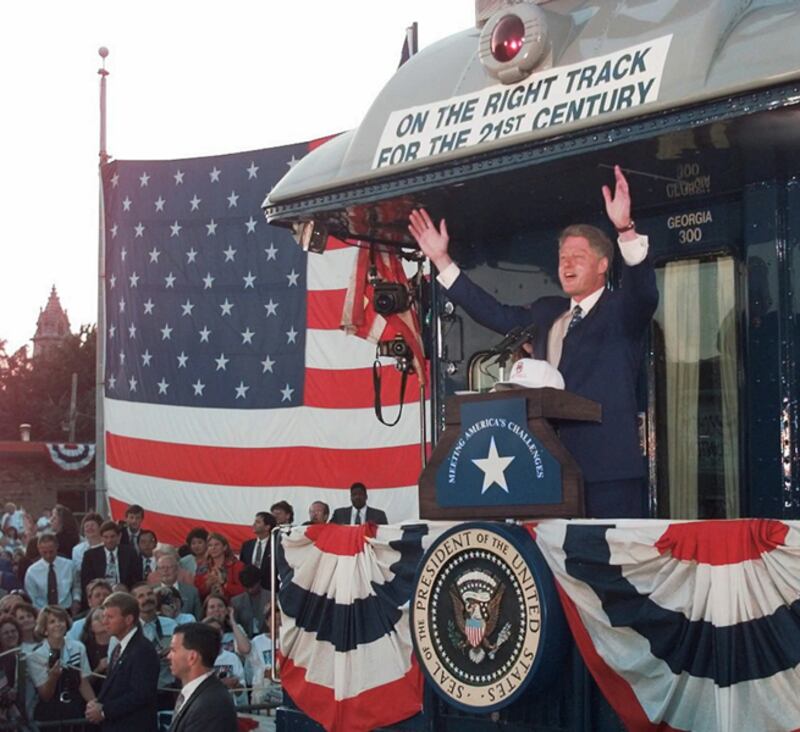
Per dollar the average American earned, Clinton earned: $9.44
Candidate income: $316,074
Average American income: $33,472
Total federal taxes paid by candidate: $75,437
Effective tax rate: 23.9%
Greg Gibson / AP Photo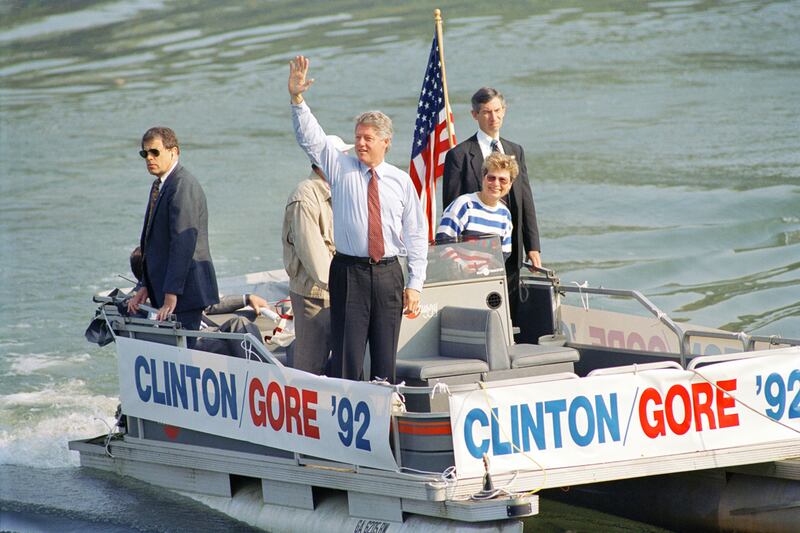
Per dollar the average American earned, Clinton earned: $8.44
Candidate income: $244,356
Average American income: $28,958
Total federal taxes paid by candidate: $49,828
Effective tax rate: 20.4%
Scott Applewhite / AP Photo
Per dollar the average American earned, Gore earned: $5.42
Candidate income: $240,930
Average American income: $44,396
Total federal taxes paid by candidate: $59,178
Effective tax rate: 24.6%
Luke Frazza, AFP / Getty Images
Per dollar the average American earned, Dukakis earned: $4.33
Candidate income: $108,000
Average American income: $24,920
Total federal taxes paid by candidate: $25,000
Effective tax rate: 23.1%
Barry Thumma / AP Photo